
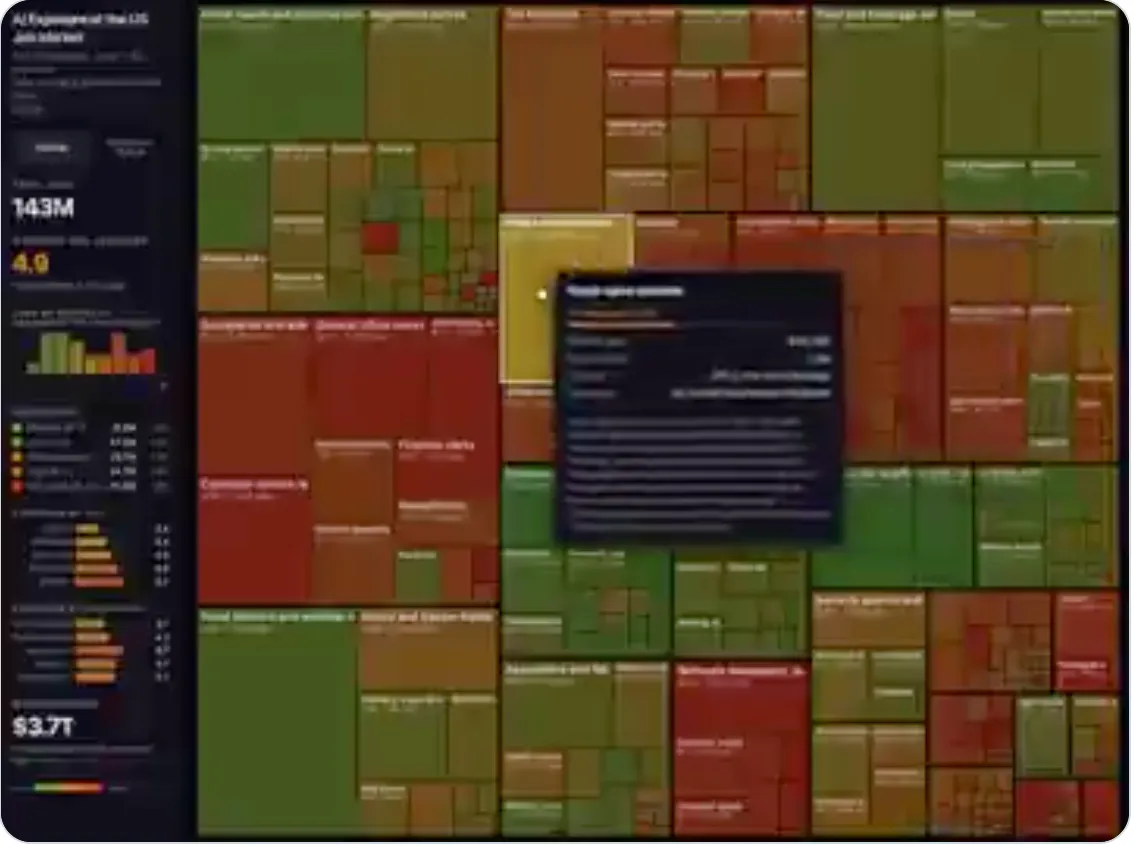
March 15, 2026, former OpenAI cofounder and former Tesla AI director Andrej Karpathy quietly launched an open‑source project on his personal site karpathy.ai/jobs. The project scraped data for 342 occupations from the U.S. Bureau of Labor Statistics (BLS) Occupational Outlook Handbook, then used large language models (LLMs, primarily Gemini Flash) to assign each occupation a 0–10 "Digital AI Exposure" score according to a detailed scoring rubric. He also built an interactive treemap visualization: block area represents employment size and color intensity represents AI exposure risk (green for low risk, red/brown for high risk). The tool quickly went viral and the GitHub repository code was widely circulated, but as it was misinterpreted as a prediction that "AI will replace these jobs," Karpathy soon took the GitHub repository down and left only the online visualization. Although the author emphasized it is a "developer tool, not a formal economic report," the project triggered intense global debate about the future of work in the AI era.
Karpathy posted on X explaining: "This was a two‑hour 'vibe coding' project on a Saturday morning, inspired by a book I'm reading. I just wanted to give people an intuitive tool to explore the BLS dataset." Nevertheless, the visualization became one of the most watched analyses of AI's occupational impact in 2026, shared and discussed by industry figures including Elon Musk, and widely covered on Reddit, LinkedIn, and Chinese tech communities.
Methodology: End‑to‑End from BLS Scraping to LLM Scoring and Visualization
Karpathy's project code was fully open‑source (GitHub repo karpathy/jobs, which was later taken down but mirrored in many places), and the pipeline is transparent with six main steps:
- Data scraping: Automated with Playwright to fetch detailed HTML pages for 342 occupations from the BLS Occupational Outlook Handbook site, including job descriptions, employment counts, median wages, education requirements, growth projections, and other key fields.
- Data cleaning and parsing: Convert HTML into clean Markdown and extract structured fields to generate an occupations.csv table.
- LLM scoring: The core step. Each occupation's detailed description (including statistics) is packaged into a prompt of about 45K tokens and sent to the LLM (Gemini Flash via OpenRouter). The scoring rubric (prompt.md) defines the 0–10 "Digital AI Exposure" scale:
- Key criterion: if the job output is fully digital and can be completed on a home computer (writing, coding, analysis, communication, etc.), the exposure is inherently higher (typically above 7).
- Anchor examples for scores:
- 0–1: Almost entirely physical, manual, or requiring real‑time interaction in unpredictable environments (e.g., roofers, landscape gardeners, commercial divers).
- 2–3: Primarily physical or interpersonal work where AI only assists marginal tasks (e.g., electricians, plumbers, firefighters).
- 4–5: Hybrid roles where AI can significantly assist the information‑processing part (e.g., registered nurses, police officers, veterinarians).
- 6–7: Knowledge‑work–dominant roles that still require human judgment or physical presence (e.g., teachers, managers, accountants).
- 8–9: Nearly entirely computer‑based with core tasks in areas of rapid AI progress (e.g., software developers, graphic designers, data analysts).
- 10: Pure information‑processing, fully digital with no physical component (e.g., data entry clerks, telephone sales agents).
- The LLM returns only JSON‑formatted scores and brief justifications, with no additional text.
- Data merging and visualization construction: CSV statistics and scoring results are merged to produce static website data files. A JavaScript‑based interactive treemap is used: block area is proportional to employment count and color corresponds to AI exposure (or other metrics like growth outlook, median wage, education). Clicking any block links to the original BLS occupation page.
- Custom extensions: The project’s standout feature is the open scoring pipeline. Users can modify prompt.md and rerun score.py to recolor the visualization by any dimension (e.g., "robot replacement risk," "offshoring risk," "climate impact").
The entire project uses Python plus the uv package manager, the frontend is static HTML, deployment is simple, and it supports local runs. Karpathy stressed repeatedly that this is not a prediction report but "a visual developer tool for exploring the BLS dataset."
Key Findings: Digital Jobs Show Highest Exposure, Average Score ~5.3/10
Based on the project data (143 million U.S. jobs):
- Average AI exposure: about 5.3/10 (weighted average ~4.9/10).
- High‑exposure occupations (8–10): software developers (8–9), graphic designers, translators, data analysts, paralegals, medical transcriptionists (10). These roles are almost fully digital and can be done remotely.
- Low‑exposure occupations (0–3): roofers, landscape gardeners, commercial divers (0–1); electricians, plumbers, firefighters, dental hygienists (2–3).
- Medium exposure: nurses, police officers, veterinarians (4–5); teachers, managers, accountants, journalists (6–7).
Karpathy's key insight is clear: "If a job's output is purely digital and can be done remotely, its exposure is inherently high." This explains why knowledge‑economy roles show higher scores while jobs requiring physical presence, manual skills, or real‑time interpersonal interaction remain comparatively safer.
Community Reaction and Aftermath
The project went viral but also sparked controversy as many misread the scores as predictions that "AI will eliminate these jobs." That misunderstanding led Karpathy to take down the GitHub repo (leaving only the visualization). He clarified on X: "The scores reflect how AI may reshape work, not a projection of employment numbers. Software developers scored high because AI can boost their productivity—demand might even rise."
Elon Musk reposted and commented: "Interesting data." Discussions surged on LinkedIn and Reddit; some called it "harsh but truthful," while others criticized the subjectivity of the scores. Chinese communities (Zhihu, Bilibili, 36Kr) also exploded with coverage, with headlines like "Andrej Karpathy scores 342 occupations with AI" and "Digital jobs most at risk."
Significance: An Open‑Source Template for an AI‑Era Occupational Map
Although not a rigorous economic forecast, Karpathy's project offers a valuable open‑source tool:
- Visualization innovation: The treemap makes large‑scale occupation data immediately accessible and supports multidimensional switching (AI exposure, wages, growth, education), far beyond traditional tables.
- Methodological openness: The full pipeline (scraping, parsing, LLM scoring, visualization) is open‑source, enabling anyone to customize prompts and recolor the map, greatly lowering the barrier to analyzing AI's occupational impact.
- Practical insight: It highlights that "digital + remote" is a core signal of AI exposure, offering intuitive guidance for education, career planning, and policy.
- Limitations: Karpathy repeatedly emphasized the scores are rough LLM estimates and do not account for demand elasticity, regulation, social preferences, and other factors. A high score does not equal job loss, nor does a low score guarantee safety.
Conclusion: An "Honest Mirror" of Jobs in the AI Era
With a two‑hour "vibe coding" session, Andrej Karpathy presented the world with a "map" of U.S. occupations' exposure to AI: 342 jobs, LLM scores, and an interactive treemap. Although the GitHub repository was quickly taken down due to misinterpretation, the project's open‑source spirit and clear insights have left a lasting impression.
The tool reminds us that in the AI era, work that is purely digital and remotely executable is inherently vulnerable, while occupations requiring physical presence, manual skill, or complex interpersonal interaction retain natural barriers. Going forward, career advisors, educational institutions, and policymakers should take this "AI exposure map" seriously.
As AI capabilities continue to advance in 2026, Karpathy's small project may prove more practically useful than many grand papers — it provides the most direct way to ask everyone: how "digital" is your job?
▶️ Enjoy this piece? Creating content is hard!
Follow our YouTube channel:
AI Rosetta
Your likes, subscriptions, and shares are our greatest support! 🙏
More AI news at: https://www.airosetta.com